
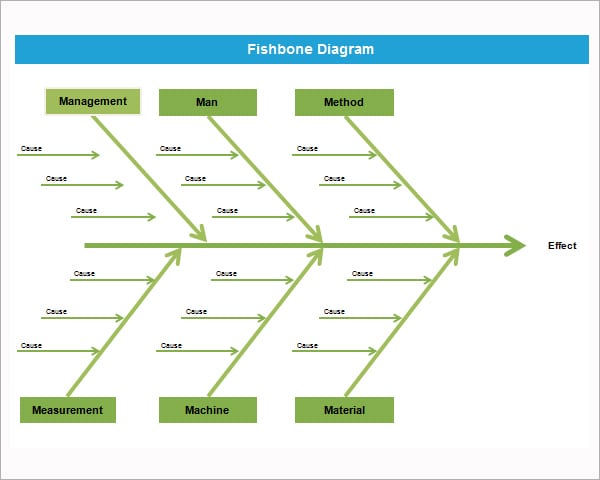
A fishbone diagram template organizes possible causes of a clearly defined problem into branches for investigation. It helps a team ask better questions; it does not establish a root cause by itself. The linked resource here is an Excel workbook, so review its editable structure before preparing a presentation.
Use a logic model to explain an expected process, a action plan to assign the response to tested findings and a daily log sheet to collect dated observations. Keep proposed causes, supporting evidence and chosen actions distinct so the diagram remains an investigation tool.
This page contains one diagram preview and one local resource link with an XLSX extension. The visible download is an Excel workbook rather than a PowerPoint presentation. Inspect its contents and editable elements before planning how to use it. If you need a slide for presentation, prepare that output separately from the workbook rather than assuming a PowerPoint file is provided.
Use the template when several factors may contribute to an observed issue and people need a shared view of what to examine. ASQ describes the fishbone as a tool for sorting possible causes into useful categories. The guide below explains the structure, then develops a fictional investigation example and a way to connect suggestions with evidence and follow-up work.
What Is a Fishbone Diagram?
A fishbone diagram is a visual problem-solving technique used to explore the root causes of a specific problem or outcome. Instead of immediately choosing a solution, a team can use the diagram to brainstorm possible causes and arrange them into logical categories.
A cause and effect diagram template is particularly helpful when a problem has multiple contributing factors. For example, a manufacturing company experiencing defective products may investigate equipment, materials, employees, methods, measurements, and environmental conditions to determine where the problem originates.
How Does a Fishbone Diagram Work?
To create a fishbone diagram, start by clearly defining the problem or effect that needs to be investigated. Write this problem at the end of the diagram. Next, identify major categories of potential causes and add them as branches from the central line.
Team members can then brainstorm specific causes and place them under the appropriate category. This creates a visual map of possible contributing factors and makes it easier to identify areas requiring further investigation.
The purpose is not simply to list as many causes as possible. The diagram helps organize thinking and encourages a team to investigate relationships between different causes before deciding which ones are most significant.
Free Fishbone Diagram Template
A free fishbone diagram template can save time when conducting a root cause analysis. Instead of drawing the structure manually, you can start with a prepared diagram and add the problem, categories, and potential causes.
An editable fishbone analysis template can be adapted for different industries and problems. You can change category names, add additional branches, remove unnecessary sections, and customize the diagram for your particular analysis.
Fishbone Diagram for Root Cause Analysis
One of the most common uses of a fishbone diagram is root cause analysis. When an organization experiences a recurring problem, identifying the underlying cause is often more valuable than simply correcting the immediate symptom.
For example, if a company is experiencing late deliveries, the team might investigate staffing, scheduling, transportation, inventory, suppliers, communication, and processes. The fishbone diagram allows these possibilities to be organized visually before the team determines which factors require further investigation.
Common Fishbone Diagram Categories
The categories used in a fishbone diagram depend on the problem being analyzed. In manufacturing and quality management, the commonly used 6M fishbone diagram categories are often Materials, Methods, Machines, Measurement, Manpower, and Mother Nature or Environment.
Other industries may use categories such as people, process, technology, equipment, environment, policy, and management. There is no requirement to use exactly the same categories for every problem. The most effective Ishikawa diagram template is one that reflects the circumstances being investigated.
Fishbone Diagram in Business and Quality Management
Businesses can use a fishbone diagram for quality improvement, customer complaints, production problems, service failures, project delays, workplace issues, and process inefficiencies. Because the diagram presents information visually, it can be particularly useful during team meetings and problem-solving sessions.
A fishbone diagram can also complement other improvement methods such as brainstorming, the 5 Whys, Pareto analysis, process mapping, and corrective action planning.
Using a structured template makes it easier to document the analysis and share the results with managers, employees, clients, or project stakeholders.
How to Create a Fishbone Diagram
Start with one clearly defined problem rather than several unrelated problems. Write the problem at the end of the diagram and establish the major cause categories.
Next, brainstorm possible causes with the people who understand the process. Add each cause to the appropriate branch and continue asking why the cause may have occurred. Once the diagram is complete, review the possible causes and determine which ones require evidence or further investigation.
A fishbone diagram is most effective when it is based on actual information rather than assumptions. The final diagram should help the team identify which potential causes are worth investigating further.
Make the problem statement measurable enough to investigate
Write what was observed and where it occurred, using information the team can support. For a fictional dispatch team, three of twelve orders reviewed last week lacked a package reference at handover is more specific than dispatch is terrible. The statement identifies the sample and observed issue without claiming that every shipment has the same problem.
Avoid building a suspected cause into the problem statement. Staff forgot the reference assumes an explanation, while package reference missing describes the observation. Keeping that distinction gives the team room to consider process, system or information issues instead of beginning with blame.
Confirm that the problem is within the intended scope. If some orders follow a different process, state which process the investigation covers. A large diagram combining unrelated failures may be harder to examine than separate diagrams with clear boundaries.
A fictional dispatch investigation
The team chooses branches called information, process, system and handover. Under information, it records the possibility that the source order omitted the package identifier. Under process, it records that the packing check may not require the field. Under system, it proposes that a printed export might hide the field. Under handover, it notes that two teams may use different references.
Each entry is a hypothesis, not a finding. The team can now ask which records or observations would support or weaken each explanation. For the printed-export hypothesis, it could compare the relevant system record and the actual handover printout for the affected orders.
A log sheet can organize those observations with dates, order references and what was checked. Keep the observation wording factual. Printed reference absent from the reviewed copy is different from software always deletes references, which would require much broader evidence.
Record evidence separately from the drawing
Use a companion record to identify the proposed cause, evidence needed, person responsible and review status. A diagram alone may not have enough space for the full explanation. Give branches or items clear references so the team can connect the evidence record with the correct suggestion.
Distinguish evidence found, evidence not yet reviewed and a hypothesis not supported by the available check. Do not delete an inconvenient explanation merely because another cause seems easier to address. Record why the team is setting it aside or keeping it for further work.
If the investigation involves only a small sample, state that limitation. Three affected orders can help identify a question, but the sample does not automatically establish a rate for all future orders. Match the claim to the information actually examined.
Keep cause investigation separate from choosing an action
A decision tree can help map choices or conditional routes once a decision needs to be made. Its branches represent a different structure from a fishbone’s possible-cause categories. A fishbone does not select the best corrective action simply because one branch has more text than the others.
When the team chooses an action supported by its review, state what will change, who is responsible and how the result will be checked. A task list can track the assigned work and its due date. The action should refer to the investigated issue so a later reviewer understands why it was selected.
Avoid marking the problem solved when a task has only been assigned. Implementation, observation of the result and a conclusion about effectiveness are separate stages. Define the follow-up check and keep outstanding work visible.
Present the diagram without making it unreadable
Use concise cause labels and move detailed notes to the companion record. If the text becomes crowded, review whether branches are duplicated or whether unrelated problems have entered the scope. More branches do not necessarily make the investigation more useful.
Label the version, problem scope and investigation status when sharing it. A draft brainstorm should not look like a final finding. If the diagram is exported or placed on a slide, inspect the actual output for clipped text and readable labels.
Keep the editable working record and the shared presentation connected by a clear version reference. When evidence changes the team’s view, update the appropriate notes and explain the change. The diagram is useful because it organizes reasoning, not because its visual shape proves a cause.
Fishbone diagram preview and Excel workbook resource

Fishbone diagram template FAQs
Is the linked resource a PowerPoint file?
The visible download link has an XLSX extension, indicating an Excel workbook. No direct PowerPoint link is shown. Inspect the workbook and prepare any required presentation output separately rather than assuming the title describes the file format.
Does a fishbone diagram prove the root cause?
No. It organizes possible explanations. Review appropriate records, observations or other evidence before treating a proposed cause as a supported finding. Keep draft hypotheses and conclusions clearly distinguished.
Must I use the traditional six categories?
Choose categories that fit the problem and help the team organize its ideas. Manufacturing categories may be useful in some settings, while a service process may need different headings. The category labels should support investigation rather than force every issue into an ill-fitting branch.
How should I phrase the problem at the head?
Describe the observed issue and scope using information you can support. Avoid embedding blame or a suspected explanation in the problem statement. A clear observation gives the team room to investigate several possibilities.
What should happen after brainstorming?
Identify evidence needed, assign review work and record what the team finds. Choose any follow-up action based on the investigation and define how its result will be checked. A completed drawing alone does not show that an action was implemented or effective.
